完成自己的第一个策略:双均线

jupyter
2509
legacy
Published

2025-09-25

# 完成自己的第一个策略:双均线
# 1) 使用 trade_utils.get_nasdaq() 获取“纳指相关ETF”伪数据(价格约1.8,工作日)
# 2) 实现双均线交叉策略(SMA 短期/长期)
# 3) 初始资金 10000 元,手续费 万0.5(0.05%),买卖以 100 的整数倍
# 4) 输出关键指标:夏普、年化收益、最大回撤
# 5) 使用 Seaborn/Matplotlib 绘制:价格与均线(标注买卖点)+ 资金曲线

from __future__ import annotations

import math
from typing import Tuple, Dict
import os

import numpy as np
import pandas as pd
from trade_utils import get_nasdaq, apply_chinese_font

import matplotlib.pyplot as plt
import seaborn as sns

# 应用 trade_utils 提供的中文字体函数,并设置 seaborn 主题(内部会处理 rc 与回退)
_chosen_cjk_font = apply_chinese_font(set_seaborn=True)  # 可能返回 None
Matplotlib 中文字体设置: Microsoft YaHei
# 参数
SHORT_WINDOW = 10
LONG_WINDOW = 30
INITIAL_CASH = 10_000.0
COMM_RATE = 0.0005  # 万0.5 = 0.05%
LOT_SIZE = 100      # 100 股整数倍
# 数据准备
raw = get_nasdaq()
df = pd.DataFrame(raw)
df["date"] = pd.to_datetime(df["date"])  # 确保为时间类型
df = df.sort_values("date").reset_index(drop=True)

# 计算均线信号(以收盘价为基准)
df["sma_s"] = df["close"].rolling(SHORT_WINDOW, min_periods=1).mean()
df["sma_l"] = df["close"].rolling(LONG_WINDOW, min_periods=1).mean()
df["signal"] = 0
df.loc[df["sma_s"] > df["sma_l"], "signal"] = 1   # 做多
df.loc[df["sma_s"] < df["sma_l"], "signal"] = 0   # 空仓
df["signal_shift"] = df["signal"].shift(1).fillna(0)
df["cross"] = df["signal"] - df["signal_shift"]   # 1 上穿,-1 下穿
# 回测执行(改为:根据信号在“次日开盘”成交,权益按当日收盘估值)
def backtest_ma(df_price: pd.DataFrame) -> Tuple[pd.DataFrame, Dict[str, float]]:
    n = len(df_price)
    if n == 0:
        out = df_price.copy()
        out["equity"] = INITIAL_CASH
        return out, {"sharpe": float("nan"), "annual_return": 0.0, "max_drawdown": 0.0, "final_equity": INITIAL_CASH, "start_equity": INITIAL_CASH, "trades": 0}

    cash = INITIAL_CASH
    pos = 0  # 持仓股数

    # 用于标注实际执行的买卖点(发生在 j=1..n-1 的开盘价)
    exec_buy = [float("nan")] * n
    exec_sell = [float("nan")] * n

    # 第0天尚未执行任何交易,权益=现金
    equity_list = [cash]
    trades = []  # 记录每笔交易

    for j in range(1, n):
        # 使用前一日信号在当日开盘执行
        prev_signal = int(df_price.loc[j - 1, "signal"])  # 目标头寸信号
        open_px = float(df_price.loc[j, "open"])          # 执行价:当日开盘

        if prev_signal == 1 and pos == 0:
            # 买入满仓(LOT_SIZE 向下取整)
            max_shares = math.floor(cash / (open_px * (1 + COMM_RATE)) / LOT_SIZE) * LOT_SIZE
            if max_shares > 0:
                cost = max_shares * open_px
                fee = cost * COMM_RATE
                cash -= (cost + fee)
                pos += max_shares
                exec_buy[j] = open_px
                trades.append({"date": df_price.loc[j, "date"], "price": open_px, "shares": max_shares, "side": "BUY", "fee": fee})
        elif prev_signal == 0 and pos > 0:
            # 卖出清仓
            proceeds = pos * open_px
            fee = proceeds * COMM_RATE
            cash += (proceeds - fee)
            exec_sell[j] = open_px
            trades.append({"date": df_price.loc[j, "date"], "price": open_px, "shares": pos, "side": "SELL", "fee": fee})
            pos = 0

        # 按当日收盘估值权益
        close_px = float(df_price.loc[j, "close"])
        equity = cash + pos * close_px
        equity_list.append(equity)

    out = df_price.copy()
    out["equity"] = pd.Series(equity_list, index=out.index)
    out["exec_buy"] = exec_buy
    out["exec_sell"] = exec_sell

    # 指标计算
    metrics = compute_metrics(out["equity"], trading_days_per_year=252)
    metrics["trades"] = len(trades)
    win_rate = compute_win_rate(trades)
    if win_rate is not None:
        metrics["win_rate"] = win_rate

    return out, metrics


def compute_metrics(equity: pd.Series, trading_days_per_year: int = 252) -> Dict[str, float]:
    equity = equity.astype(float)
    daily_ret = equity.pct_change().fillna(0.0)

    # 夏普(无风险利率近似为0)
    avg = daily_ret.mean()
    vol = daily_ret.std(ddof=0)
    sharpe = (avg / vol * np.sqrt(trading_days_per_year)) if vol > 0 else np.nan

    # 年化收益
    n = len(equity)
    ann_ret = (equity.iloc[-1] / equity.iloc[0]) ** (trading_days_per_year / max(n, 1)) - 1.0 if n > 1 else 0.0

    # 最大回撤
    roll_max = equity.cummax()
    dd = equity / roll_max - 1.0
    max_dd = dd.min()

    return {
        "sharpe": float(sharpe),
        "annual_return": float(ann_ret),
        "max_drawdown": float(max_dd),
        "final_equity": float(equity.iloc[-1]),
        "start_equity": float(equity.iloc[0]),
    }


def compute_win_rate(trades: list) -> float | None:
    # 基于成对的 BUY-SELL 计算胜率
    if not trades:
        return None
    pnl_list = []
    entry_price = None
    entry_shares = 0
    for t in trades:
        if t["side"] == "BUY":
            entry_price = t["price"]
            entry_shares = t["shares"]
        elif t["side"] == "SELL" and entry_price is not None:
            pnl = (t["price"] - entry_price) * min(entry_shares, t["shares"])
            pnl_list.append(pnl)
            entry_price = None
            entry_shares = 0
    if not pnl_list:
        return None
    wins = sum(1 for x in pnl_list if x > 0)
    return wins / len(pnl_list)
# 运行回测
bt_df, metrics = backtest_ma(df)
# 输出关键指标
def fmt_pct(x: float) -> str:
    if pd.isna(x):
        return "nan"
    return f"{x*100:.2f}%"

print("===== 关键指标 =====")
print(f"初始资金: {INITIAL_CASH:.2f}")
print(f"最终权益: {metrics['final_equity']:.2f}")
print(f"年化收益: {fmt_pct(metrics['annual_return'])}")
print(f"最大回撤: {fmt_pct(metrics['max_drawdown'])}")
print(f"夏普比率: {metrics['sharpe']:.3f}")
if 'trades' in metrics:
    print(f"交易笔数: {metrics['trades']}")
if 'win_rate' in metrics:
    print(f"胜率: {fmt_pct(metrics['win_rate'])}")
===== 关键指标 =====
初始资金: 10000.00
最终权益: 9821.07
年化收益: -1.73%
最大回撤: -8.43%
夏普比率: -0.201
交易笔数: 11
胜率: 20.00%
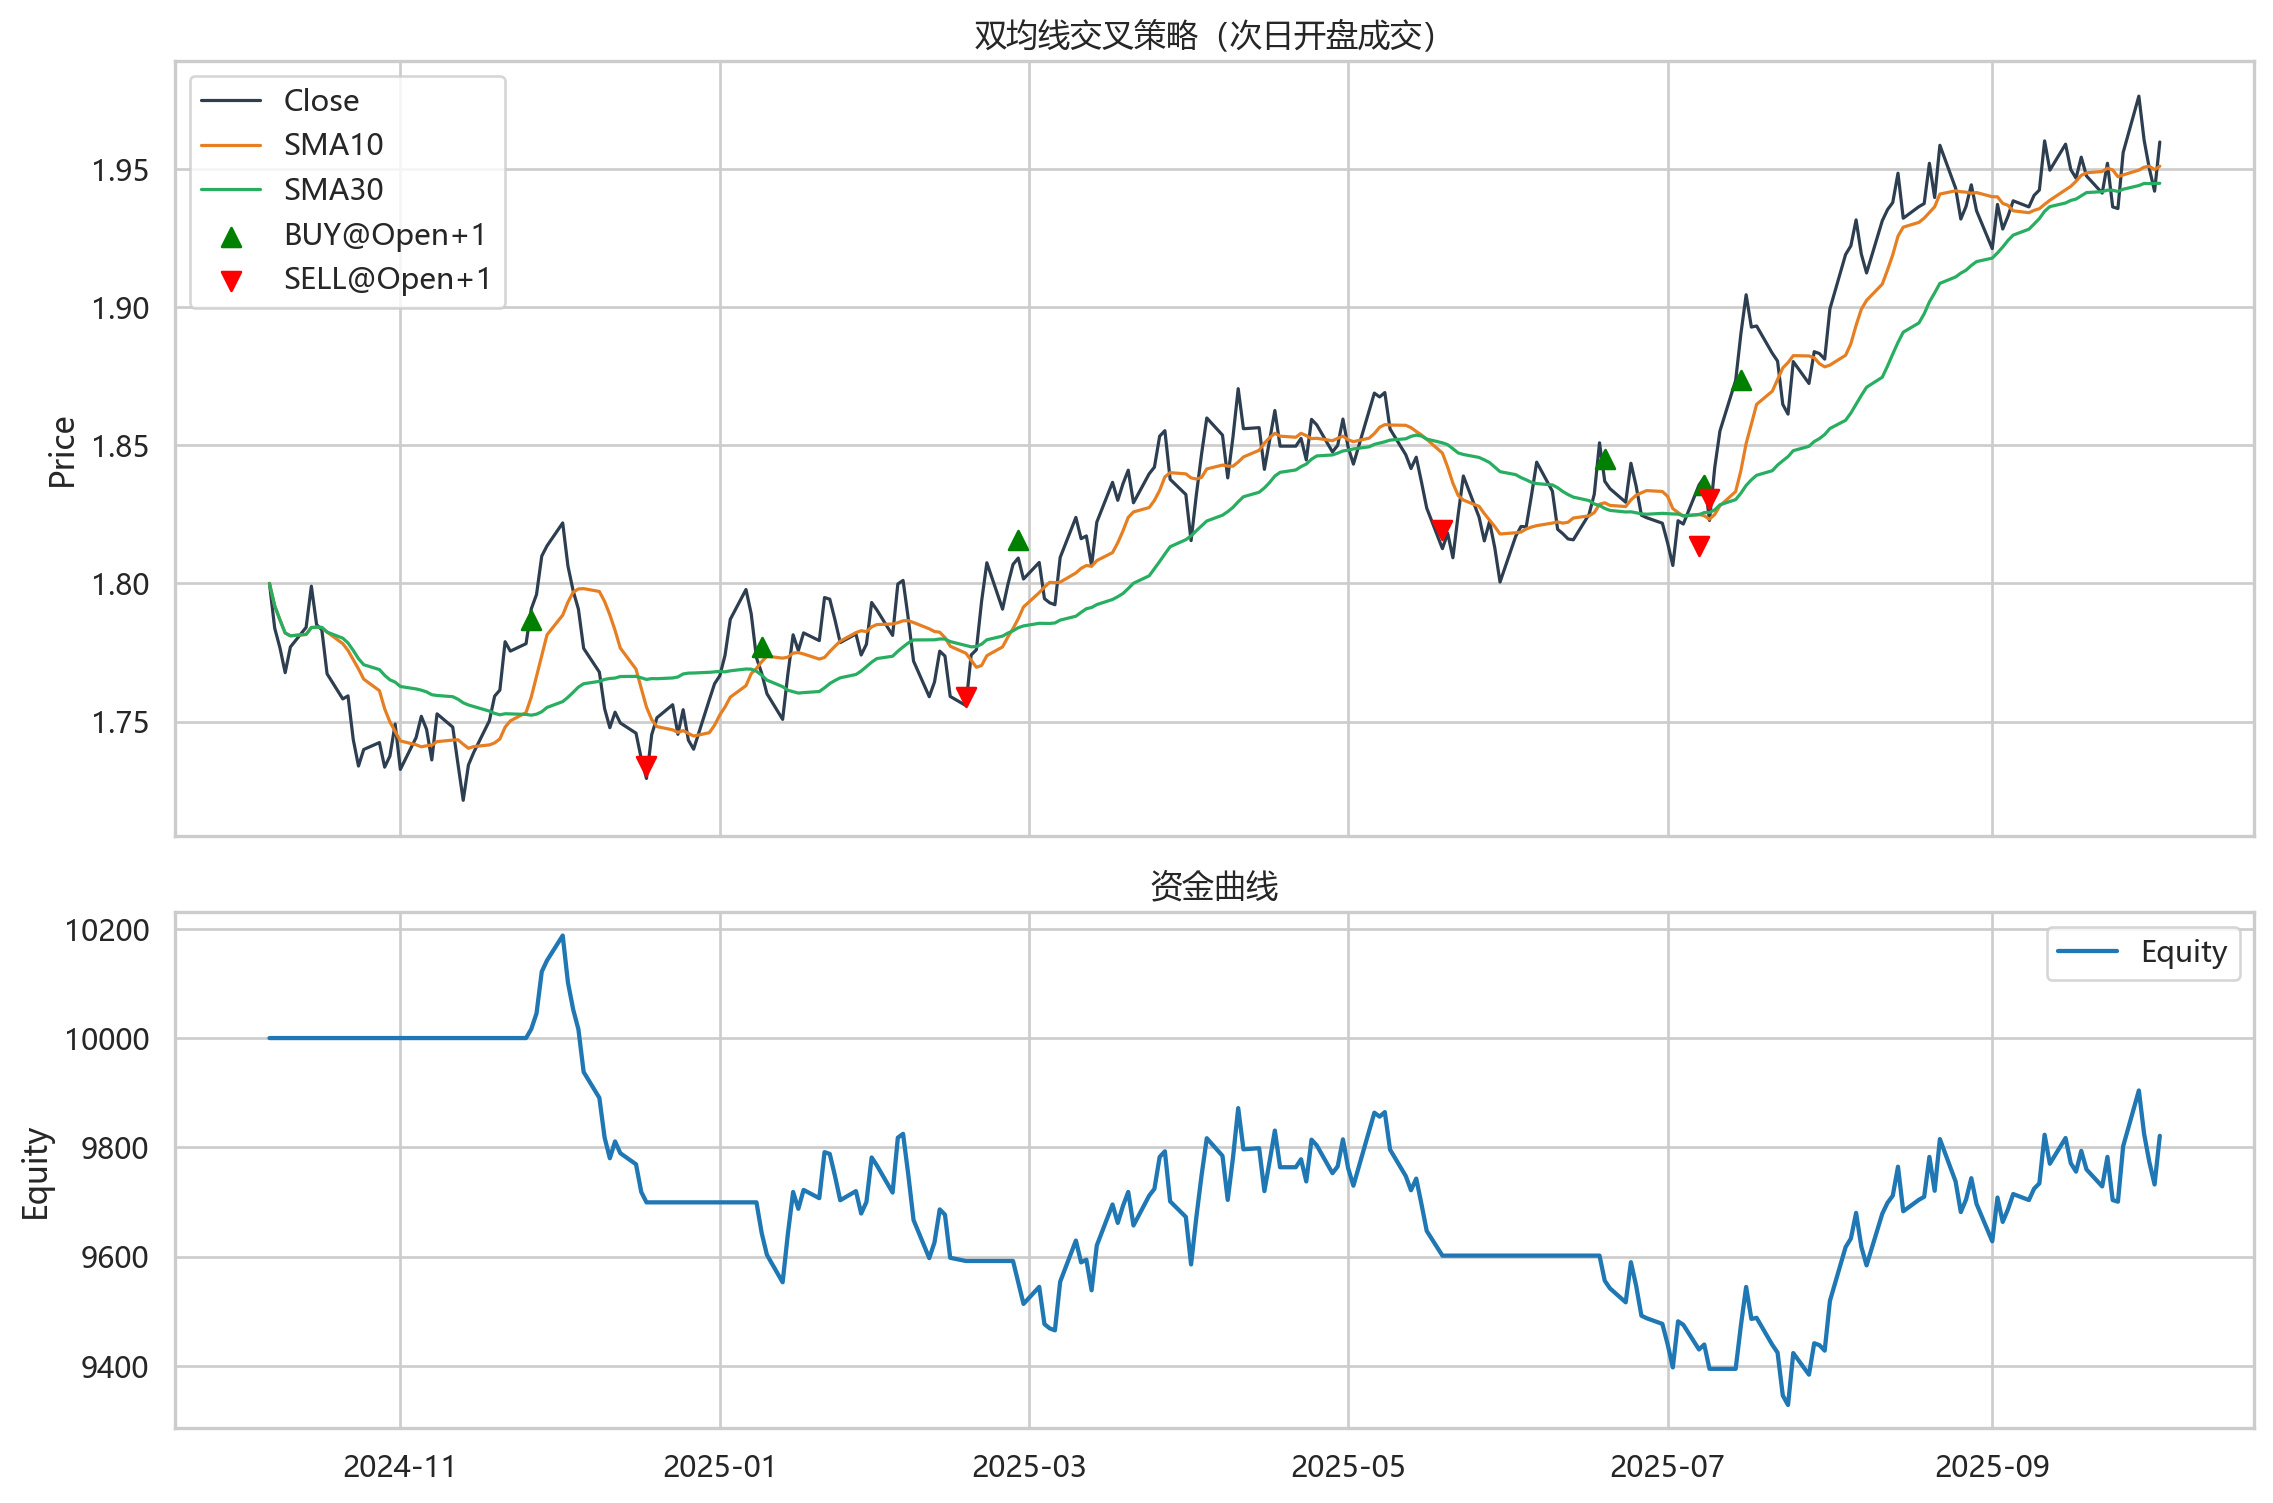
# Seaborn/Matplotlib 绘图:收盘价+均线+执行点(上) + 资金曲线(下)

# seaborn 主题已在 apply_chinese_font 中设置
fig, axes = plt.subplots(2, 1, figsize=(12, 8), sharex=True, gridspec_kw={"height_ratios": [3, 2]})
ax_price, ax_equity = axes

# 上图:价格与均线
ax_price.plot(bt_df["date"], bt_df["close"], label="Close", color="#2c3e50", linewidth=1.2)
ax_price.plot(bt_df["date"], bt_df["sma_s"], label=f"SMA{SHORT_WINDOW}", color="#e67e22", linewidth=1.2)
ax_price.plot(bt_df["date"], bt_df["sma_l"], label=f"SMA{LONG_WINDOW}", color="#27ae60", linewidth=1.2)

# 买卖点
buy_mask = ~bt_df["exec_buy"].isna()
sell_mask = ~bt_df["exec_sell"].isna()
ax_price.scatter(bt_df.loc[buy_mask, "date"], bt_df.loc[buy_mask, "exec_buy"],
                 label="BUY@Open+1", color="green", s=50, marker="^", zorder=3)
ax_price.scatter(bt_df.loc[sell_mask, "date"], bt_df.loc[sell_mask, "exec_sell"],
                 label="SELL@Open+1", color="red", s=50, marker="v", zorder=3)
ax_price.set_title("双均线交叉策略(次日开盘成交)")
ax_price.set_ylabel("Price")
ax_price.legend(loc="best")

# 下图:资金曲线
ax_equity.plot(bt_df["date"], bt_df["equity"], label="Equity", color="#1f77b4", linewidth=1.6)
ax_equity.set_title("资金曲线")
ax_equity.set_ylabel("Equity")
ax_equity.legend(loc="best")

plt.tight_layout()

plt.show()